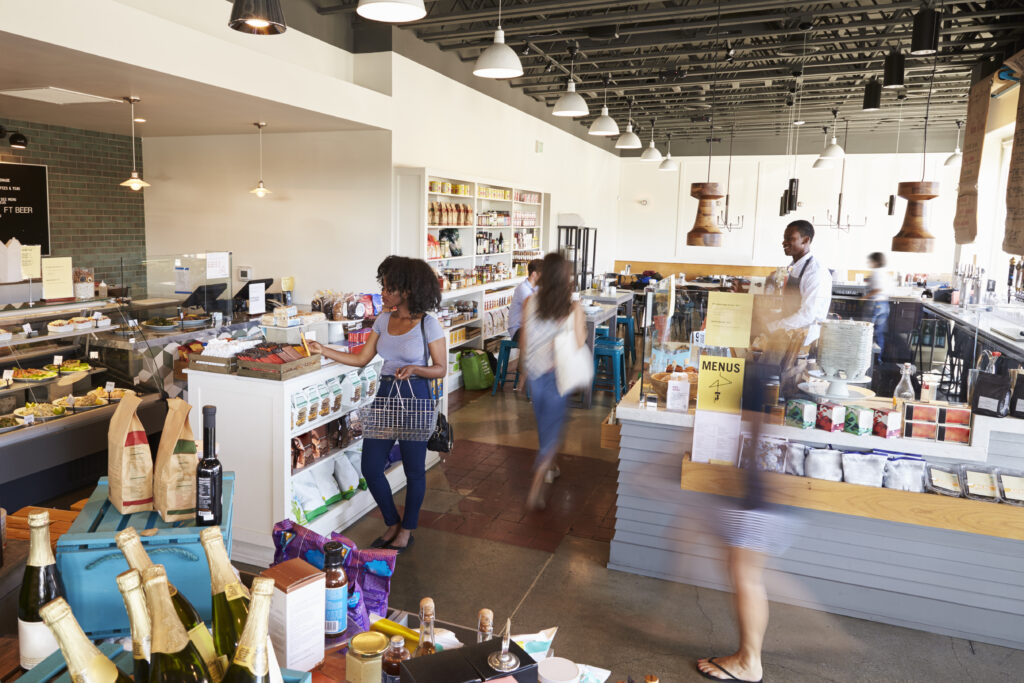



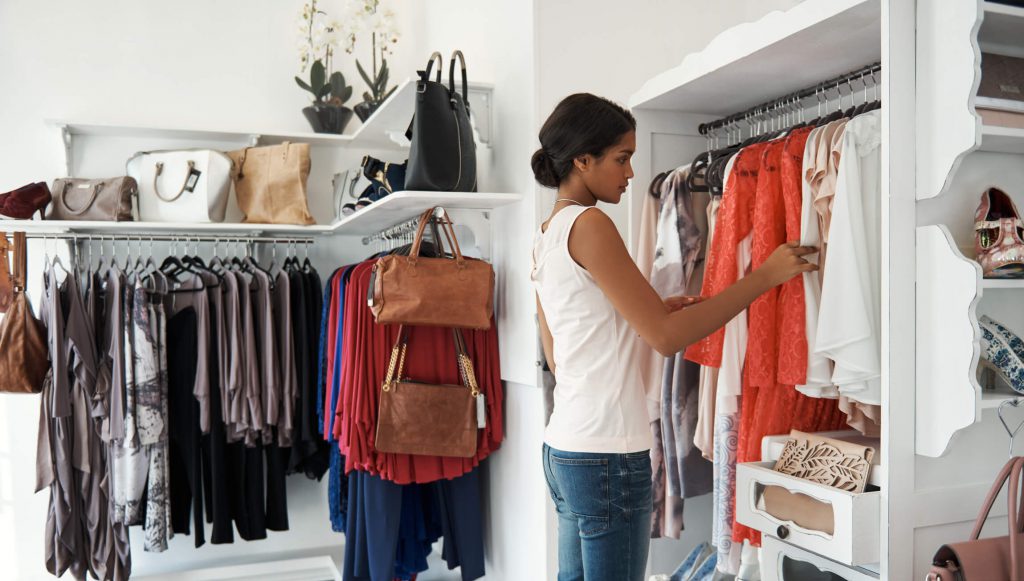
What is a planogram? Also known as “shelf plans,” planograms are a visualization tool for understanding how products are arranged in a space and for optimizing trade marketing. They make it much simpler to see how many items from each brand are on a shelf, how easy they are to see and reach, and what impact that has on shoppers.
Planograms are essential for retailers because they are studies for creating more efficient layouts and store designs that drive sales growth.
In today’s article, you’ll learn what it takes to create a planogram and how each of these steps benefits your business. Ready to learn? Let’s get started!
Place your most profitable products at the front of the store
The main point of a planogram is to figure out how to display a product so that it’s seen by everyone who walks into your store. That’s why planograms work as tools for boosting results with trade marketing, since they prioritize partners’ items. However, it’s not enough to simply put out the products that are part of that strategy, since there may be many of them and they don’t always deliver the same profitability for the business.
Ideally, your shelf plan should increase the visibility of the products that bring the highest return for your brand. Making this arrangement work, therefore, will require a very good relationship with your supplier.
Although restocking shelves happens frequently, it’s much better to have inventory on hand to keep them consistently full with the products that generate the most revenue for both the business and the partner.
We need to distinguish the most profitable products from the traffic drivers. The items that a large share of your customers look for every time they visit the store should be placed farther from the entrance, because they’re essentials. They’ll motivate customers to walk through the space and see other products that might interest them.
Follow a logic when organizing prices
One tool you can’t do without at the POS is price psychology. This term refers to the changes in how shoppers perceive a product’s cost based on the way we arrange products. One way to boost the average ticket is to create the sense of a psychological price, a type of impulse purchase.
When organizing your shelves, placing prices that look like deals in the most visible spots will increase sales of the selected products.
Manage store products by category
Category management is a key piece of trade marketing because it uses data to guide store setup. Figures such as retail value, sales volume, market share, price and competition will guide how products are arranged in a store by category. They’re what determine which items need more space and which ones no longer need to be part of the store’s assortment, for example.
Categories will reveal sales opportunities and show which areas of the store can have their shopping experience optimized by applying strategies such as adjacency — placing similar products near one another.
Place promotions in strategic locations
Have you ever stopped to think that where promotions are located in your store influences how well they perform? Endcaps are the best spots for offers because they provide the greatest visibility for people moving through the space. Islands are also widely used in planograms to deliver a similar effect, since they’re central points in store aisles.
For promotions to really reach visitors who weren’t planning to buy a particular product, you need to assess how much profit each one delivers for the store. The most profitable ones should always be in a more prominent position than the less profitable ones.
Track customer behavior
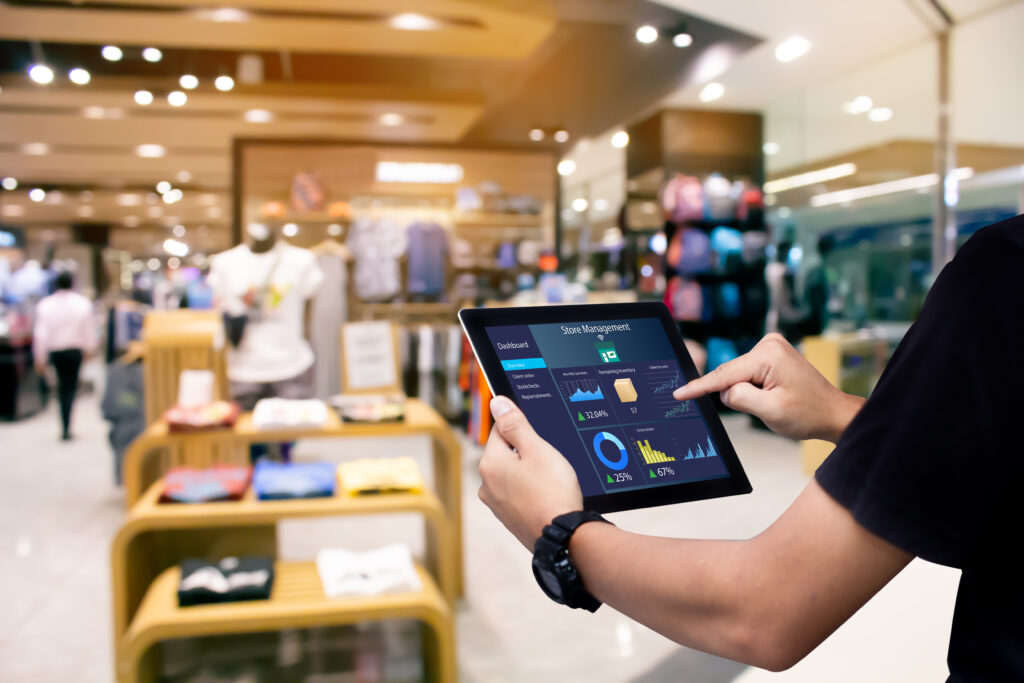
Technology plays a very important role in creating planograms. Software is often used to understand how each planogram works and benefits a business; however, it’s data collection that makes them effective. Tracking how shoppers navigate the store will better inform these systems about what’s needed to create a good shelf plan.
Motion sensors are a great choice for getting accurate information about how customers move around the POS. They generate data that’s fed into these solutions so they can understand exactly how to take advantage of this spontaneous movement.
Businesses that don’t have sensors, however, aren’t left without data to base their planograms on; they just need to gather it differently. Employee feedback and camera footage review will inform how shelf plans are built and reveal specific shopper behaviors.
Physically map your products
Every store has cold spots and hot spots (and they have nothing to do with the refrigerators in a supermarket). Cold spots are the areas with less traffic that attract fewer people, while hot spots are the opposite.
You need to map these spots if you want to tap into your store’s full potential. Observing shopper behavior will help here, but trial and error can be even more effective. People tend to get used to moving through a store the same way they always have, so periodically moving your products will let you figure out whether a given arrangement was the best one or just the familiar one.
Watch the results you get from each of these changes to create the ideal planogram.
Developing a planogram is no easy task. Experts can help you better understand how each of these points influences the shopping experience and improves results in your store.
Consulting with a team that knows the subject and has many years of market experience will ensure effective shelf plans for your POS.
So, do you now understand what a planogram is and how to start creating one for your store? Visit the AliceWonders page and check out our retail success stories!
Inscreva-se em nossa Newsletter
Receba no seu email todas as novidades do nosso blog sobre tecnologia e varejo, além de ficar por dentro do novos projetos Alice Wonders.
Thank you for subscribing.
Something went wrong.
Respeitamos sua privacidade e levamos a sério a sua proteção