




New POS technologies are emerging more and more often to streamline processes and gather new information that feeds retail strategies. The heat map is one more of these trends, and it will let you see what happens in your store from an angle you never imagined.
Stay with us to find out what heat maps are, what they can tell you about how your store operates and how consumers behave, and to learn some strategies you can put into practice with the information they provide. Check it out!
What is a heat map?
A heat map is a type of graphical representation that shows the reader data on activity, concentration, and other kinds of numerical values distributed across a given space. In general, areas with higher numerical values are shown in warmer colors, while those with lower values are shown in cooler colors.
It’s very common to see heat maps in TV news weather forecasts, for example. In that case, the value represented on the map of Brazil is temperature, so the regions of the country that will be hotter the next day are colored orange and red, while those expected to be cooler appear in green and blue.
Among the other data a heat map can represent is foot traffic, that is, the movement of a given audience within a certain space over a period of time.
Because of the simple way it presents information, the heat map has become a POS trend and is already used by managers who like to innovate and who value implementing sales strategies based on accurate data.
To collect the information shown in heat maps, devices that identify the location of customers’ smartphones through their wireless networks are typically used. In places that offer free Wi-Fi, it’s also possible to cross-reference customers’ paths with other information from their profiles, such as gender, age, address, and so on.
What does a heat map say about my store?
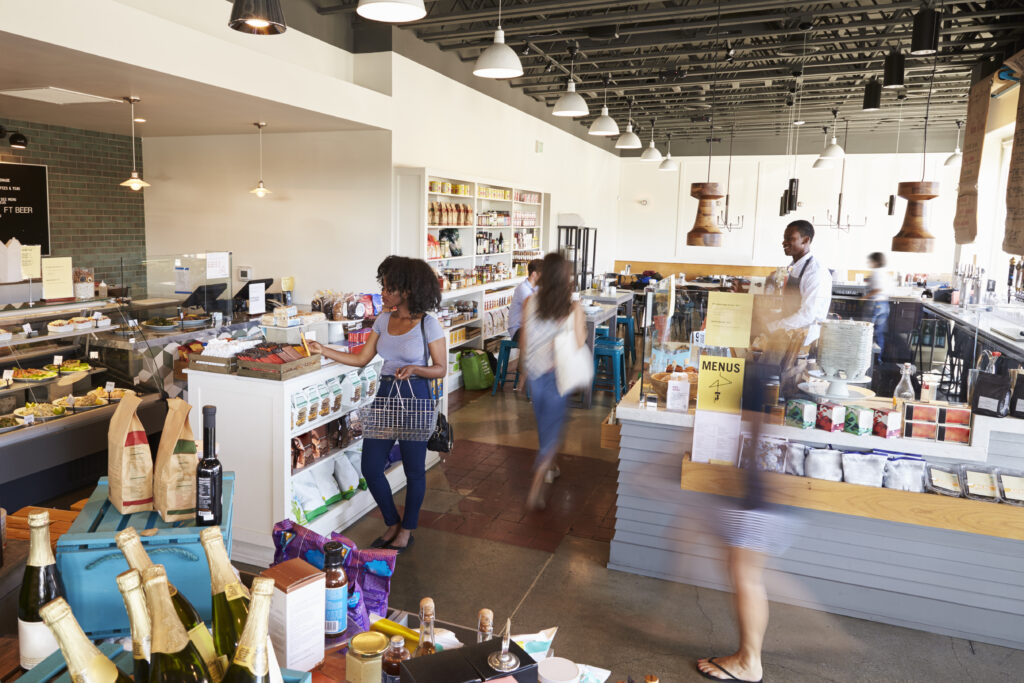
With the help of equipment capable of identifying the location and path each customer takes inside your store, you can collect information about visits over a given period of time and compile it into a heat map. That way, the chart will represent customer traffic in each area of your store.
Using the color legend of cool colors for low concentrations and warm colors for high ones, you’ll be able to distinguish low- and high-traffic zones, as well as the most common paths through the store.
By varying the time periods observed, you can also discover differences in consumer behavior on different days of the week, or even throughout the same day, so the store can be better prepared for special situations.
Traffic is also a data point that indicates the ability of each area of the store, or a given set of products, to retain customers. With this benchmark, it becomes easier to tap into your layout’s potential to keep visitors in the store interacting with products.
When it comes to making better use of resources and staff, a heat map helps measure the length of lines or prolonged concentrations of customers, which can be addressed by creating new routines that reassign employees to complete purchases with mobile devices or to provide other kinds of customer assistance.
None of this information is a complete mystery to a manager; after all, with retail experience, you develop a certain intuition about these matters. However, heat maps can free you from guesswork and numerically reveal in-store behaviors that had previously gone unnoticed, offering an opportunity to understand consumer behavior precisely.
How will this information help me sell more?
Analyzing accurate data on what happens in the store is the first step toward discovering and adopting more suitable sales strategies and improving the store’s results. After all, information like this lets you understand the successes and failures of your current strategies in much greater detail.
With that, you can rethink the store’s design to increase its influence on purchase decisions, by placing promotional materials in the highest-traffic areas or by designing paths through the store that show consumers products related to what they’re looking for as they head to the section they want.
By rearranging products or even the store layout, you can draw more customers to dead zones, making better use of the space. The reverse reasoning also works: feature in the hot zones those products that are piling up in inventory or in the cold zones and therefore need to sell more.
A heat map can also be a great tool for running an A/B test. If you want to find out which of two items attracts more attention from visitors, just display them in different areas of the store and check the heat map: the hottest zone will indicate the product that generated the most traffic. This result makes it easier to understand your audience’s preferences and to plan your upcoming offers.
Why is it important to understand customer behavior?
In a consumer-focused business, customer behavior is one of the main indicators you can use to develop strategies to capture their attention, make them feel more comfortable, keep them in the store—in short, all the steps of seduction that lead customers to trust and buy from your brand.
However, behavior varies considerably from one consumer profile to another, so it’s very important that you can identify these differences in behavior and adapt the store to win over your audience.
The heat map is one more example of a technological tool that can help you better understand consumer behavior and turn that knowledge into more sales. Tools like this show how urgent it is to adopt a culture of innovation in companies that want to grow in the 21st century.
Think your colleagues should also learn about the applications of heat maps in retail? Then share this post on social media!
Inscreva-se em nossa Newsletter
Receba no seu email todas as novidades do nosso blog sobre tecnologia e varejo, além de ficar por dentro do novos projetos Alice Wonders.
Thank you for subscribing.
Something went wrong.
Respeitamos sua privacidade e levamos a sério a sua proteção